New Tool for Understanding Vulnerable Populations in Arlington
Published on February 14, 2025
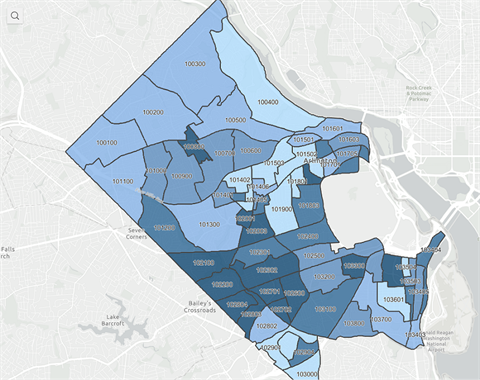
Arlington County released the Community Vulnerability Index Map (CVIM), a new tool to help identify concentrations of vulnerable populations in Arlington. The map ranks census tracts from the highest to the lowest concentrations of vulnerable populations and can assist in answering the Racial Equity Lens questions. The CVIM is one of several demographic dashboards the County has created to understand and report on population characteristics and trends in Arlington.
"We’re thrilled to add this tool to our library of demographic dashboards," said Community Planning, Housing and Development Director Samia Byrd. "The data in these tools are foundational to assessing equity throughout our community. The CVIM will help us identify where additional assistance and services might be needed to enhance life outcomes."
For this tool, vulnerability is examined in terms of Arlington’s composition and how demographic, socioeconomic, and geographic factors may increase an individual’s susceptibility to various disadvantages. The following variables were used to determine vulnerability:
- Persons of Color
- Persons under the age of 18
- Persons over the age of 65
- Lower income households
- Low-income persons
- Low educational attainment
- Persons born outside of the United States
For more information on variables and vulnerability please see the Vulnerability Mapping Methodology documentation.
Other Demographic Dashboards
The Race and Ethnicity Dashboard provides a transparent means of comparing key demographic variables of Arlington’s population by race and ethnicity.
The Census Tract Demographic Dashboard allows users to select one or more census tracts to view the demographics at the sub County level.
The CPHD Population and Demographic Estimates Dashboard provided demographic profiles for Arlington’s Civic Associations, which do not align to U.S. Census Bureau geographies.